The term "frequency distribution" comes from the field of descriptive statistics.
A frequency distribution is a set of numbers that shows how frequently each number appears in the set.
This exercise shows how frequency distributions can help us to summarize large sets of data.
Read the paragraph and answer the question below.
What Can We Learn from a Distribution?
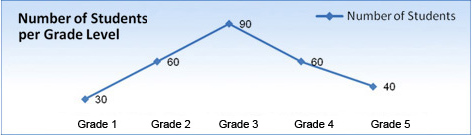
If we plot the number of students onto a graph, we get what is called a distribution curve. This gives us a visual summary or representation of the data set.
The distribution curve below shows that last year, a school had a total of 280 students. These students were distributed over five grade levels as follows:
30 students in 1st grade, 60 students in 2nd grade, 90 students in 3rd grade, 60 students in 4th grade and 40 students in 5th grade.
Which sentences below are correct according to this distribution curve? Choose the 3 correct answers.